.png)


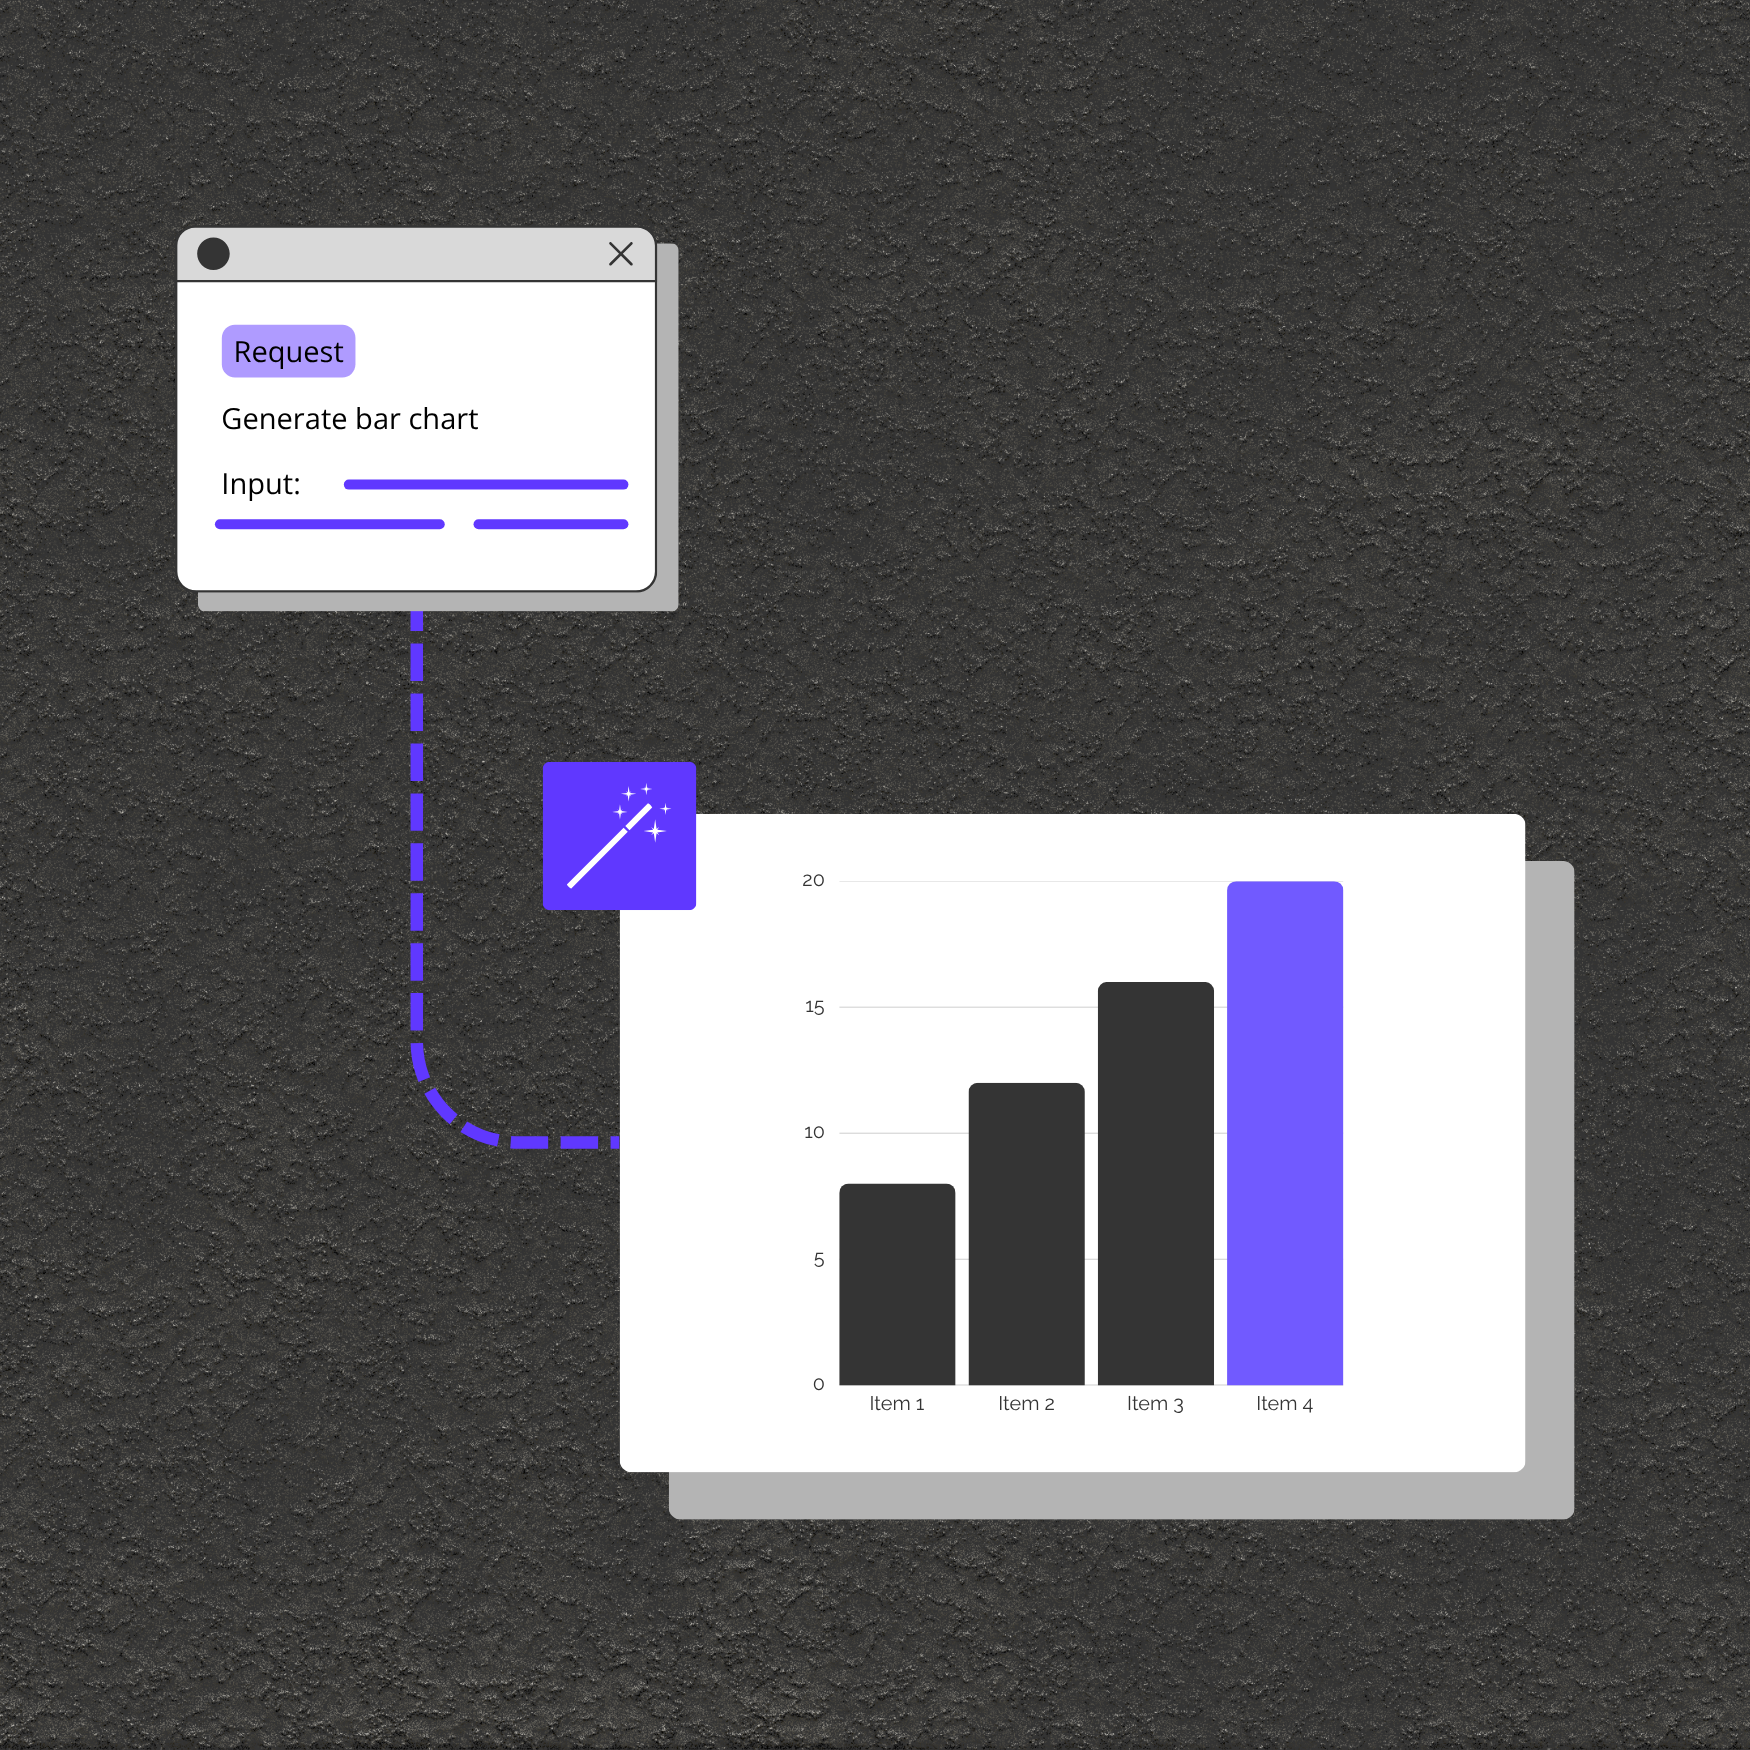
Effortlessly generate visually appealing bar chart images by simply posting your data and labels.
Personalize chart size, background color, title, bar colors, border colors, and border thickness to fit your unique style or reporting format.
Choose to receive your chart as a downloadable image or as a shareable URL for easy embedding or distribution.
Take advantage of powerful Chart.js options for deep configuration, enabling everything from grid styling to complex annotations.
Instantly visualize key metrics, trends, and KPIs for teams and stakeholders.
Generate custom charts for slide decks, websites, or social media, ensuring your data gets noticed.
Provide users with dynamic downloadable charts based on live or user-generated data.
