.png)


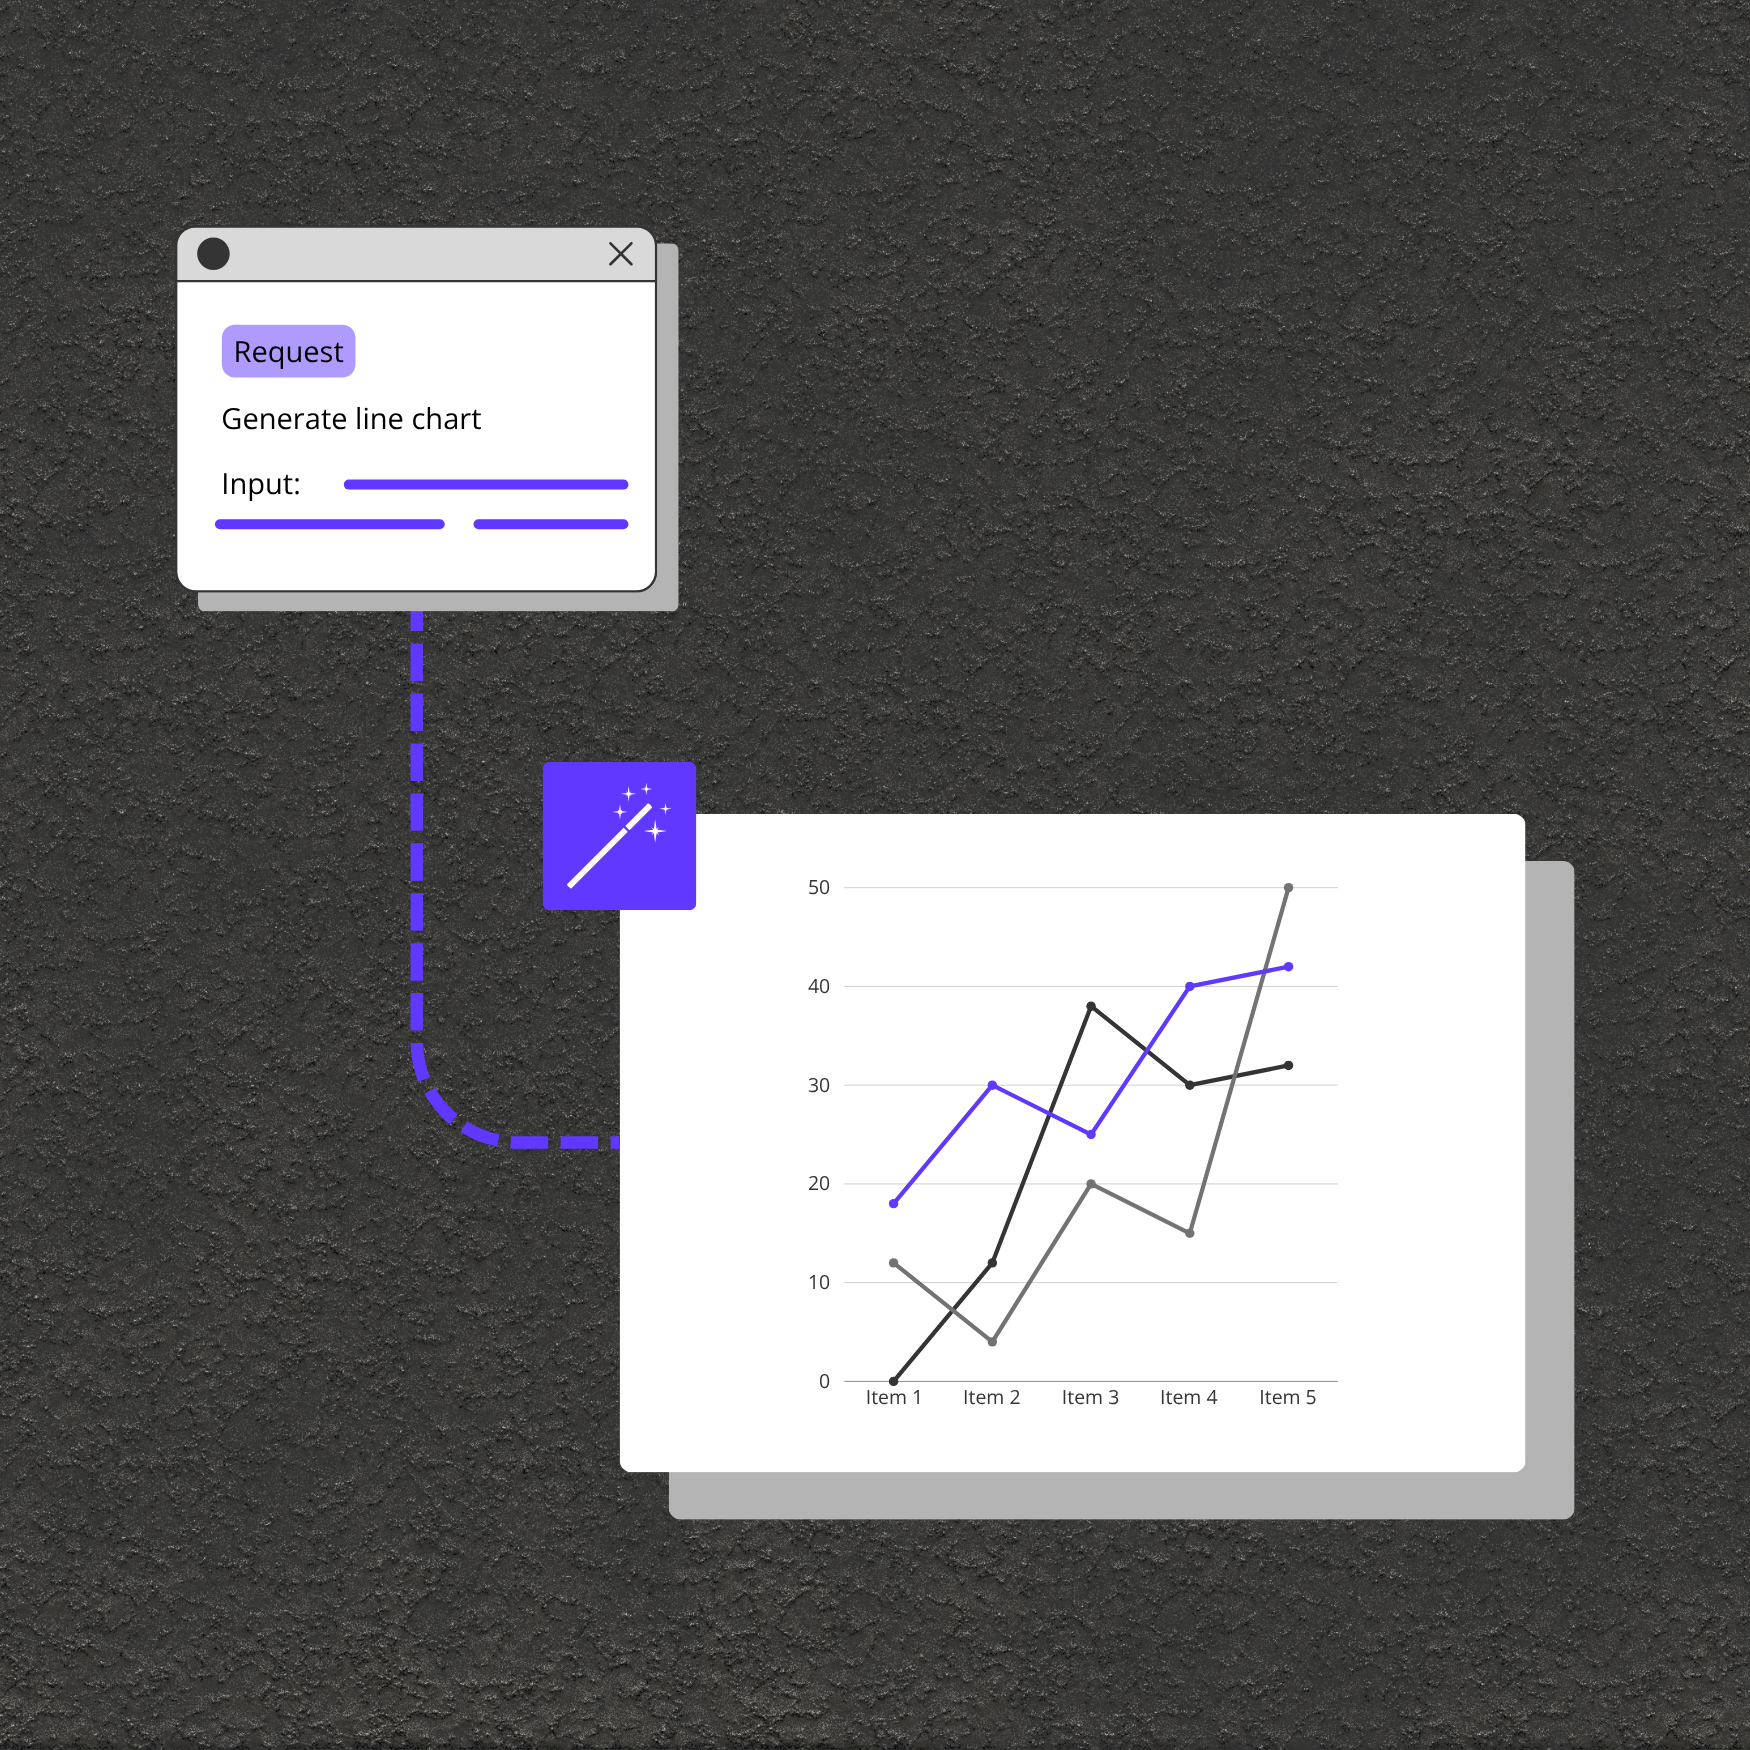
Accepts any numeric data set and matching labels to plot trends, metrics, or time series with precision.
Tailor chart width, height, colors, line thickness, tension, fills, and background to match your brand or design preferences.
Highlight trends with options for filled areas under lines, multiple line colors, and custom border styles.
Supports advanced Chart.js options for maximum control and interactivity.
Visualize sales growth, marketing KPIs, or revenue trends for board meetings and executive updates.
Embed dynamic charts in SaaS products, admin panels, or analytics platforms.
Illustrate data distributions, scientific results, or study findings in publications and educational materials.
