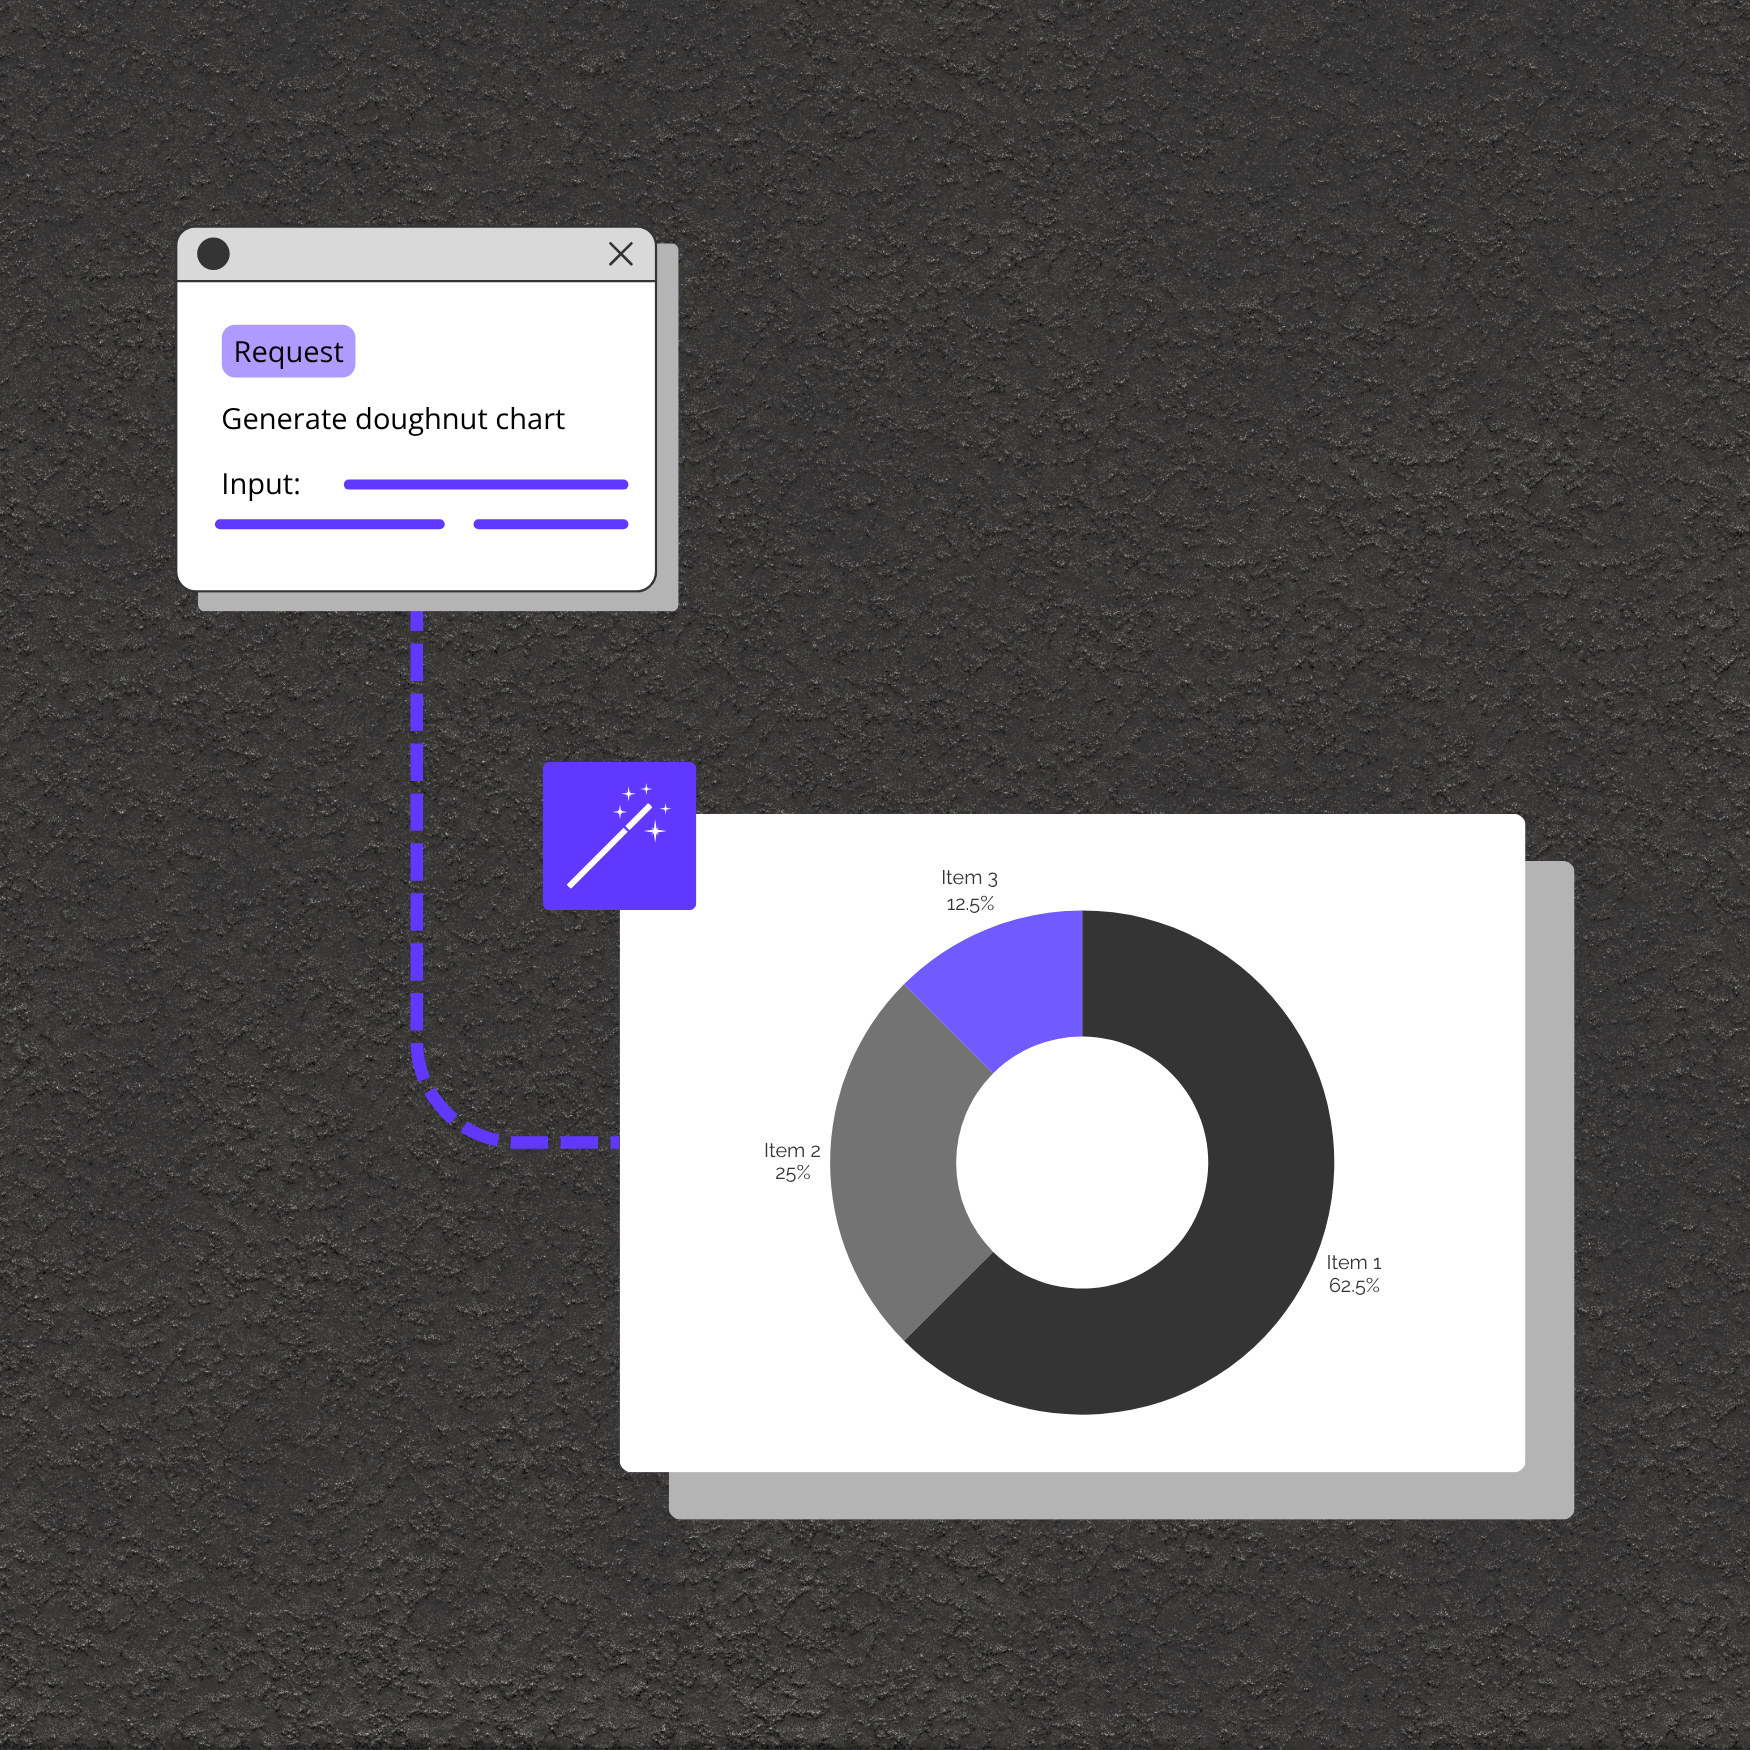
Make
,
Zapier
,
n8n
,
The Doughnut Chart Image Generator API enables you to create stunning, fully customized doughnut chart images from your raw data in just seconds. Perfect for data visualization, dashboards, business reports, and presentations, this endpoint lets you personalize every aspect of your chart for maximum impact.
With the Doughnut Chart Image Generator endpoint, you can elevate your data storytelling, enhance analytics, and engage your audience with beautiful, informative visuals, without the hassle of manual chart creation or extra graphic tools.
The rich text element allows you to create and format headings, paragraphs, blockquotes, images, and video all in one place instead of having to add and format them individually. Just double-click and easily create content.
A rich text element can be used with static or dynamic content. For static content, just drop it into any page and begin editing. For dynamic content, add a rich text field to any collection and then connect a rich text element to that field in the settings panel. Voila!
Headings, paragraphs, blockquotes, figures, images, and figure captions can all be styled after a class is added to the rich text element using the "When inside of" nested selector system.
Organize Your Data – Gather the values (data) and their corresponding categories (labels) you want to visualize.
Send a Request – Submit your data and labels in JSON format.
Endpoint Processing – The API generates a doughnut chart based on your inputs.
Receive the Chart URL – Get a URL for your chart, ready for integration or sharing.
This endpoint is your go-to solution for effortless doughnut chart creation. By transforming raw data into a sleek, shareable chart, it saves time and enhances data visualization. From professionals to students, anyone can use this endpoint to turn numbers into insights with ease.