Endpoint Usage Data on 0CodeKit

.png)
The need for proper control over endpoint usage on our platforms can be fundamental in terms of performance, cost-effectiveness, and resource utilization. Thus, effective endpoint management can help users to get an understanding of how endpoints are working, find possible problems, and make the right decisions to improve their experience. This blog is designed to help you navigate through the important components of endpoint management, starting with the usage table and further focusing on data visualization and the active resource.
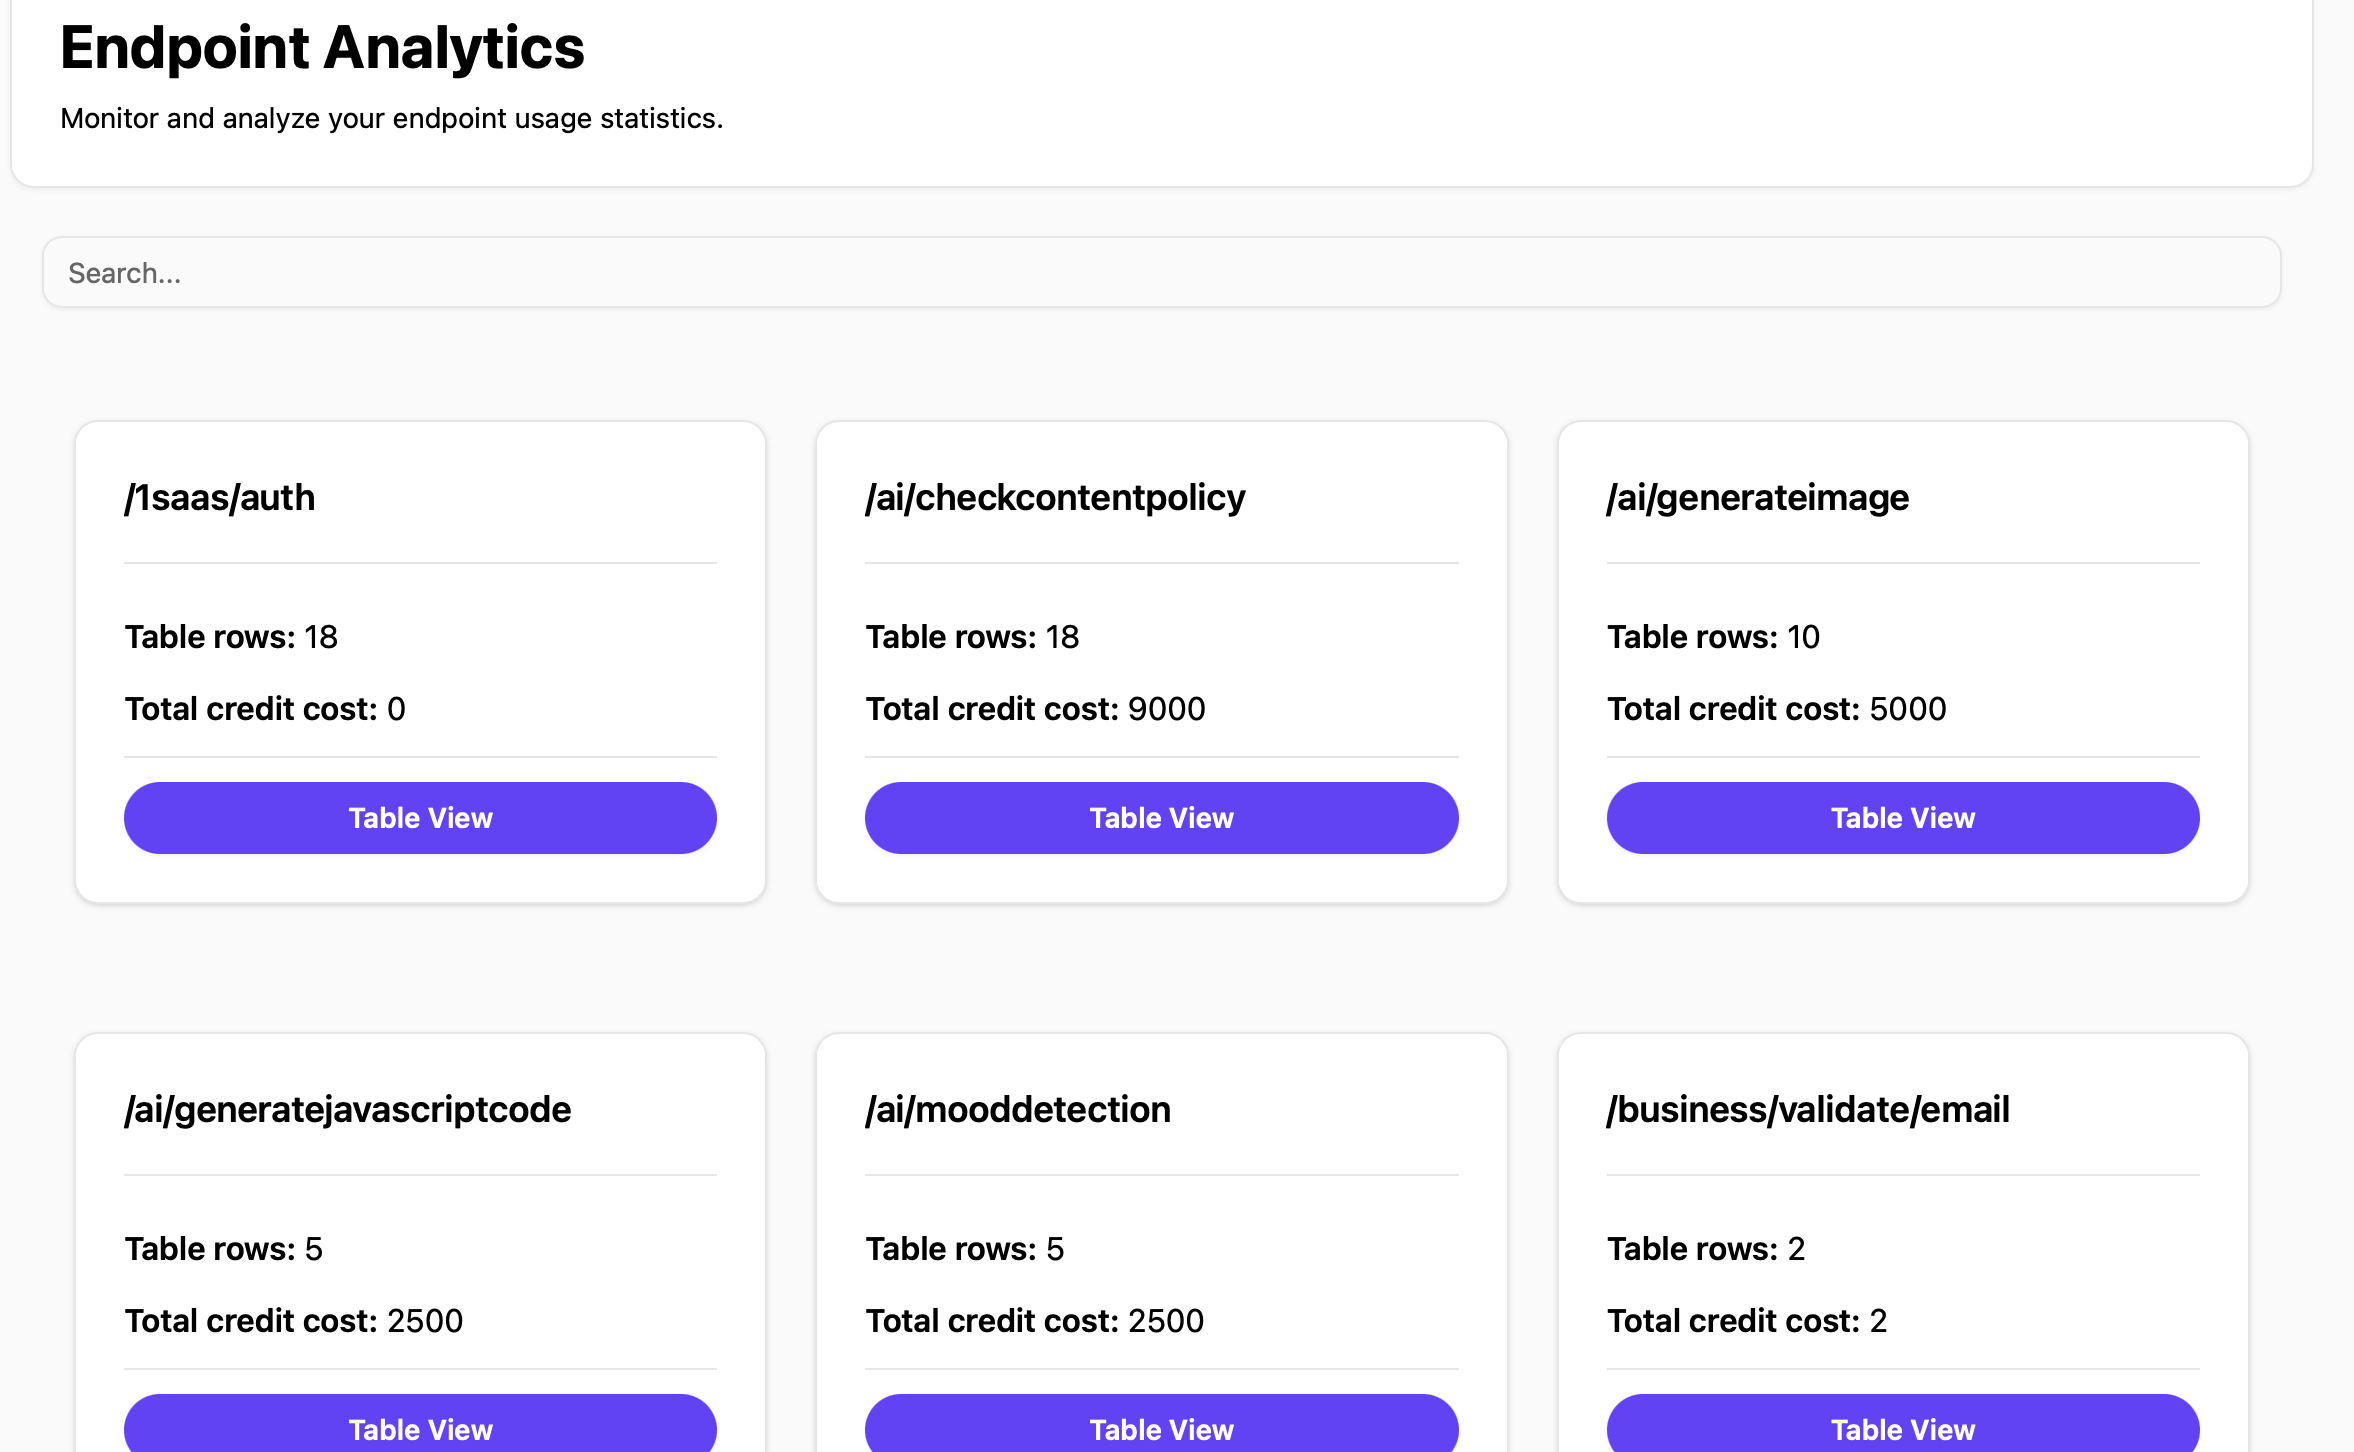
In particular, the usage table is the primary means of observing and controlling the endpoints of our platform. It offers an overview of all the endpoint activities, giving data points that would enable users to understand how such endpoints are being used. Specifically, the usage table tracks:
This way, you will get a complete picture of how the endpoints are utilized, which actions consume the most credits, and when they are performed.
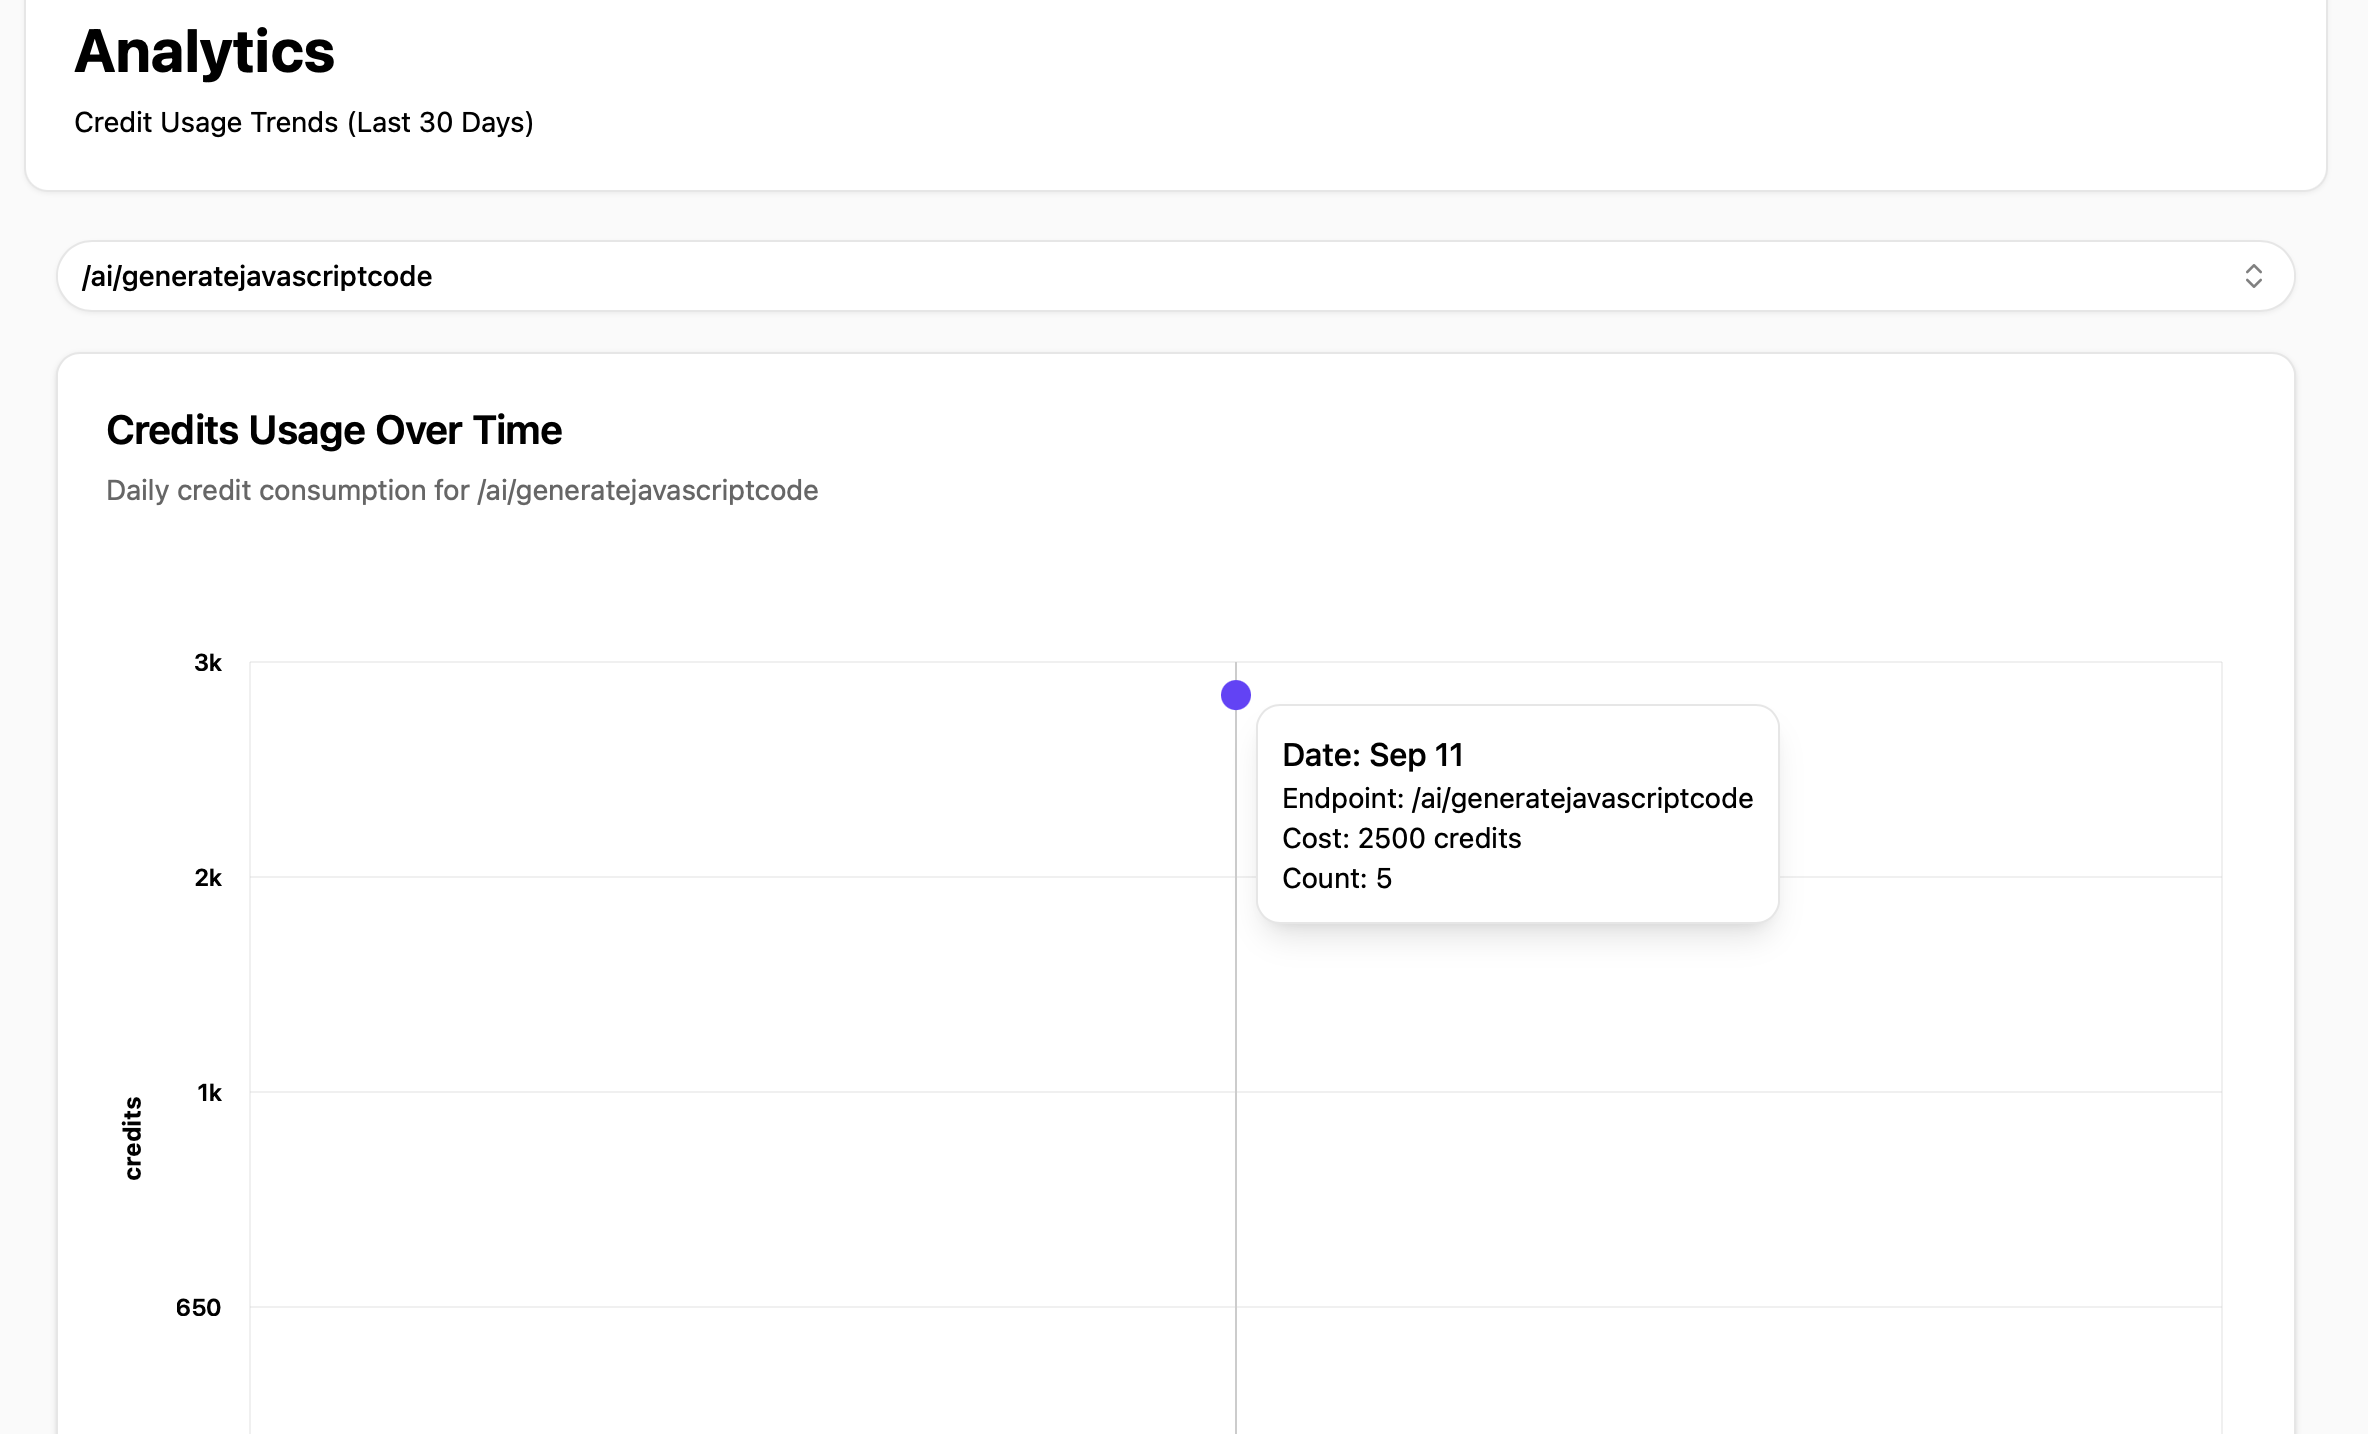
The endpoint usage chart assists in identifying trends in the consumption of credits. This chart is useful for tracking each endpoint's credit cost and identifying patterns and problems with usage.
Axes explanation:
This chart shows the trend of credit cost for users to track the frequency of their credit usage. Credit costs are plotted over time, and users can notice patterns like high or low consumption rates and identify any irregularities concerning the utilization of endpoints.
The time trends chart diverges from the others because it deals with the occurrences of the endpoints instead of a comparison on a continuum. This chart is useful to make oneself aware of how often a particular endpoint is required in the context, so that more resources can be allocated to it if necessary or so that fewer endpoints can be used if unnecessary.
Axes explanation:
This chart employs bars to depict the frequency of each endpoint so that the most used endpoints can easily be identified. Endpoint monitoring is important to know how the endpoints are being used and which are most vital.
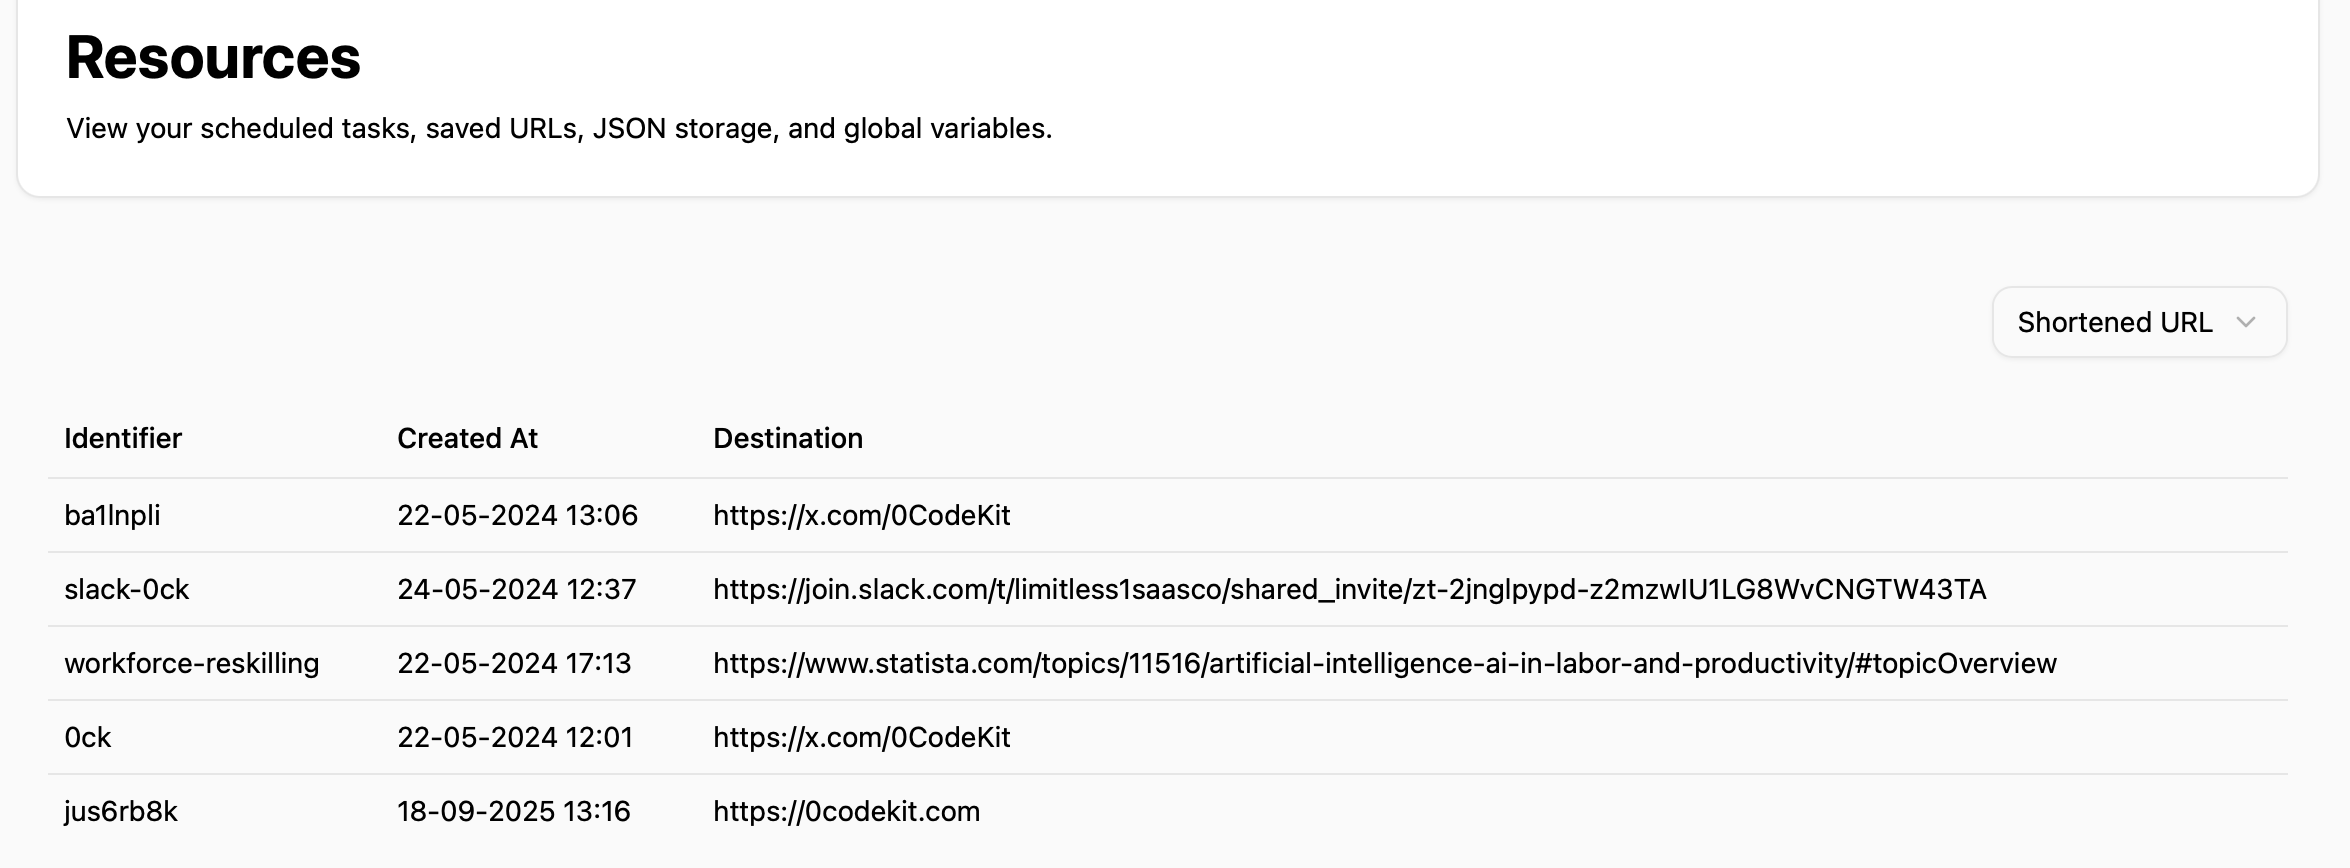
In the resources tab, one of the newest tools on our platform, users can easily control several active resources. This tool is useful for endpoint management, since it provides access to view and manage scheduled tasks, shortened URL links, global variables, and JSON bin storage. All these options enable users to manage their applications smoothly and efficiently.
Are you curious about 0CodeKit, or do you need further assistance? You might find the following blogs helpful: